
Top Tips to Make Google Analytics Work for You
A website is the digital storefront of your business, and Google Analytics is the perfect tool to determine whether that storefront is delivering. A Google Analytics report will tell you everything you need to know about your website. Who is your audience, where they are from and what they are doing on each page? The information and data contained in the reports will help you figure out what needs to happen for you to optimize your website to work for you as you are sleeping. Google Analytics can be as detailed as you need, and we will cover the top five reports you can view.
Audience
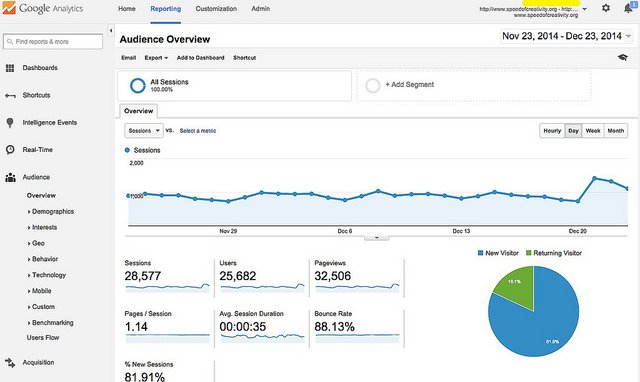
In the simplest terms, the audience portion of the Google Analytics tool is the people coming to your website. Cultivating insights for your audience will help you develop content that will address their needs.
The tool gives you metrics on your site with information on users, unique users, sessions, page views, bounce rate and more. To learn more about each category click here.
- Active users
- Lifetime value
- Cohort analysis
- Audiences in analytics
- User explorer
- Demographics
- Interests
- Geo
- Behavior
- Technology
- Mobile (devices)
- Custom
- Benchmarking
- Users flow
These may seem overwhelming at first but having a clear understanding of your audience will be a valuable insight to updating your website accordingly and determining what Search Engine Optimization (SEO) tactics you will need to apply.
Acquisition
Acquisition is the where of how your audience came to your website like search engines, social networks or website referrals. Ideally, this will be a mixed bag of sources rather than a single stream. It’s important to remember that a diverse net will lead to more visitors. This also provides good insight on which online marketing tactic is bringing in the most visitors.
- Organic search – Users come your website after using a search engine
- Paid search – Users find your website from a paid search ad
- Direct – Users type your URL into their browser or by a bookmark
- Referral – Users directed to your website from another website linking to yours
- Social – Visits to your website from a social network
- Other – This is from a custom campaign and using UTM parameters that you have previously specified
Acquisition numbers are another tool in your toolbox to determine allocation of marketing budget. If organic traffic is low, you need to spend more time and money of improving your website’s SEO, or if a referral link is high, then you are seeing a great relationship forming with another website that needs to be nurtured.
Knowing where your audience is finding you is an invaluable insight to how well your efforts are providing ROI.
Real-Time
Technology has made waiting for things obsolete, and Google Analytics real-time reports allows for monitoring activity on your site as it happens. You are able to see who is on your site right now and how they are interacting on each page.
There are a total of six reports:
- Overview – Shows the top ten pages that active users are currently on, the source of the user and the number of users on each page
- Locations – Displays the geographic location of an active user
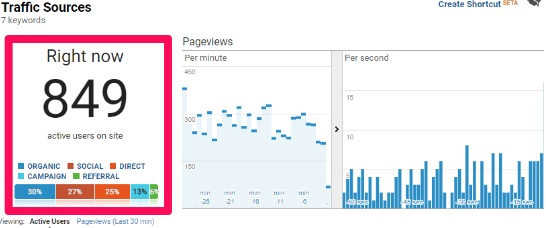
- Traffic sources – Outline which media were used to get to your website
- Content – Allows for you to see what pages/screens were being viewed for the past 30 minutes
- Events – Indicates interactions on the page, clicks/events over the past 30 minutes
- Conversions – Provides a table illustrating the goals that active users completed during their sessions, the number of users who completed each goal and the percentage of total users who completed each goal
Most people using real time reports are going to find most use in the following ways:
- Monitor whether new and changed content on your site is being viewed
- Understand usage of your mobile app through event tracking
- See whether a one-day promotion is driving traffic to your site or app and which pages these users are viewing
- Monitor the immediate effects on traffic from a blog/social network post or tweet
- Verify that the tracking code is working on your site or app
- Monitor goal completions as you test changes to your site
Behavior
The behavior report is how people are using your website giving you a dissection of what content is speaking to your audience.
The behavior overview report will give you information on:
- Pageviews – The total number of views a page has including the repeated pageviews from the same user
- Unique pageviews – The number of views from a single user (if the same user visits a page twice this number only reflects the original view)
- Average time on page – The amount of time a user has spent on a specific page
- Bounce rate – Users who visited one page and then left the website from the same page they entered on
- Exit – The number of exits on a page
The behavior report also has a flow chart which maps out what pages users enter and where they end up on your website. This will help you maximize what page is having the most traffic and what calls to action you may want to implement to help them navigate their way through the website — culminating into a conversion.
Conversions
Conversion reports reveal if your website and marketing tactics are working for your business with information like orders, sign-ups or other actionable metrics. The conversion report in Google Analytics comes in three categories:
- Goals
- E-commerce
- Multi-channel funnels
A goal conversion is something you can set up in the admin section of your Google Analytics profile, so you should prioritize setting clear goals for your website. Setting this up will give you data on how well your website preforms in relation to your defined goals such as:
- Total number of goal completions
- Goal value
- Goal conversion rate
- Goal abandonment rate
- Individual goal completions
- Top goal completion
- Top source
E-commerce is for when you enable the goal tracking on an e-commerce site offering information on product sales and checkout flow. The data yield from an e-commerce report will help you see what products are selling well, the revenue per transaction and how long it takes for a customer to make a purchasing decision.
Multi-channel funnels are a little more complex giving you information on conversions based on different channel attribution models. Take a look at our marketing funnel article to learn more about first touch vs last touch. The reports are generated from start to finish where the user came from (search engine, social media, online advertising, etc.) all the way to the predetermined goal.
And there you have it. The top reports that you can use to help your online business grow and see ROI. Navigating the world of digital marketing can be confusing, so if you need any assistance to up level your efforts feel free to reach out to us.