

How to Measure and Refine your Video Strategy on Social Media
Video is the most powerful way to increase engagement on social media. In order to ensure your video content strategy is working for you and generating the leads, you need to measure. So, what does that look like on each social media platform? Well, we will give you a play-by-play and what KPIs to look out for on each platform to get the most out of your video strategy.
Once you have the metrics you can compare them to the goals of the KPIs and figure out what is working and what isn’t. Social media will never be an exact science, but the numbers will not lie to you, and your audience is not likely to either.
The below are the metrics of each social media platform you should be measuring to ensure your video strategy is resonating with your key audience.
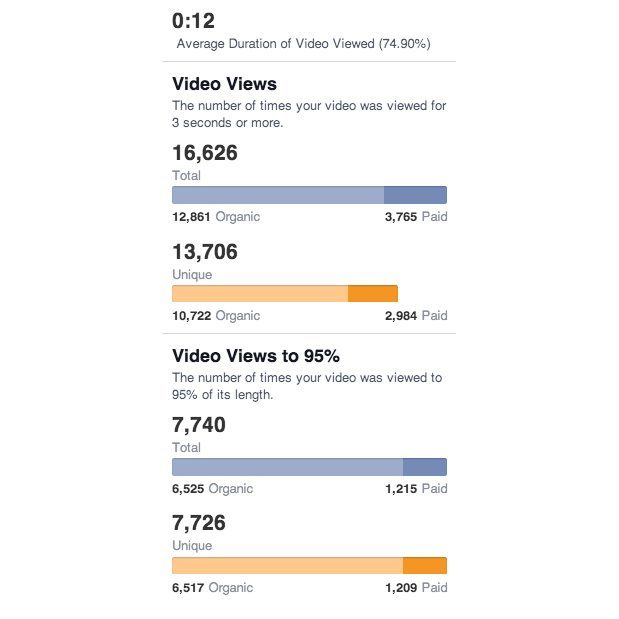
Arguably, the most powerful of the social media platforms with over 2.7 billion active users every month. The average engagement per post usually runs around 0.09%, and video leads to the MOST engagement with a rate of 6.09%. The metrics you will want to measure are:
- Reach – The entirety of the audience that your video was shown to.
- Engagement – How much users interacted with your video.
- Average video watch time – Length of time users watched your video.
- Minutes viewed – How many total minutes viewers watched your video.
- 1-minute video views – How many users watched your video for at least one minute.
- 10-second video views – How many users watched your video for at least 10 seconds.
- 3-second video views – How many users watched your video for at least three seconds.
- Audience retention – Did the video hold the audience’s attention?
- Audience – Viewer demographics including top location, top audience and people reached.
- Top videos – The most popular videos on your page.
- Unique viewers – How many unique users watched your videos.
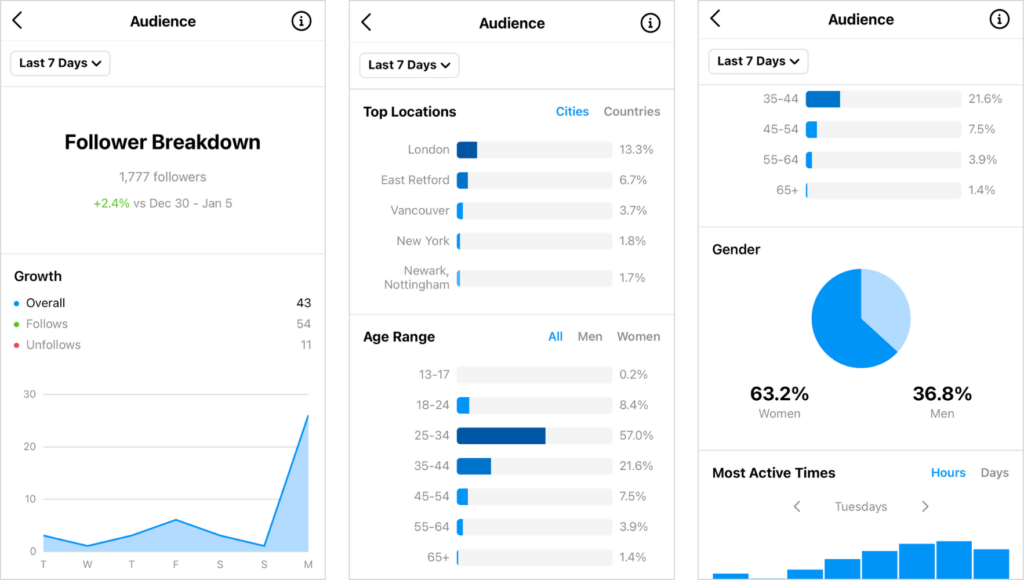
The popular photo-sharing app has one billion monthly active users and is geared more to the female demographics ages 18-24. Average engagement rates on Instagram are 1.22%.
- Views – How many views your video got that was over three seconds.
- Likes – The number of likes your video received.
- Comments – How many users commented on your video.
- Profile visits – Visits your profile gets after seeing your post.
- Saves – Amount of users that saved your video to their Instagram collections.
- Messages – How many times your video was sent to others through messages.
- Follows – The followers you got from that video.
- Reach – The number of people your video was shown to.
- Impressions – How many users saw the post.
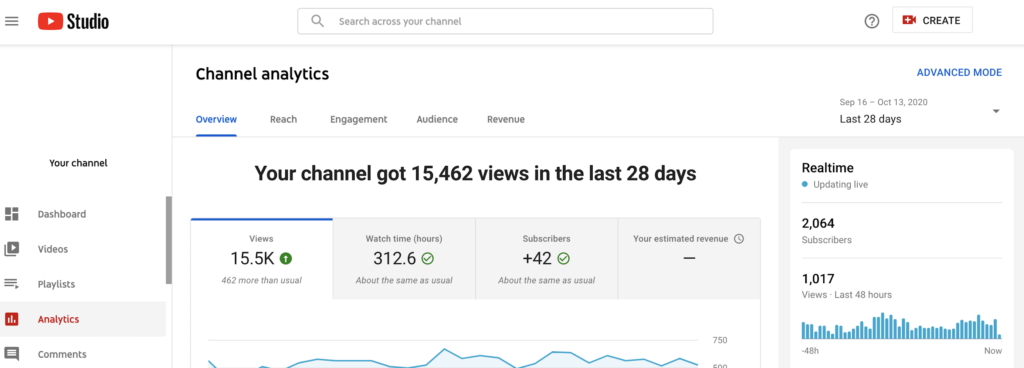
YouTube
The second-largest social media network as far as users are concerned, and also the second-largest search engine behind the Google behemoth. When looking at the metrics for YouTube you will want to pay close attention to:
- Watch time – The length of time people are watching your videos.
- Audience retention – Are people consistently watching your videos, and when do they stop watching?
- Demographics – Who is watching your videos and where they are.
- Playback locations – Where your videos are being watched.
- Traffic sources – Where people discover your videos.
- Devices – What percentage of your views come from desktop, mobile, or elsewhere.
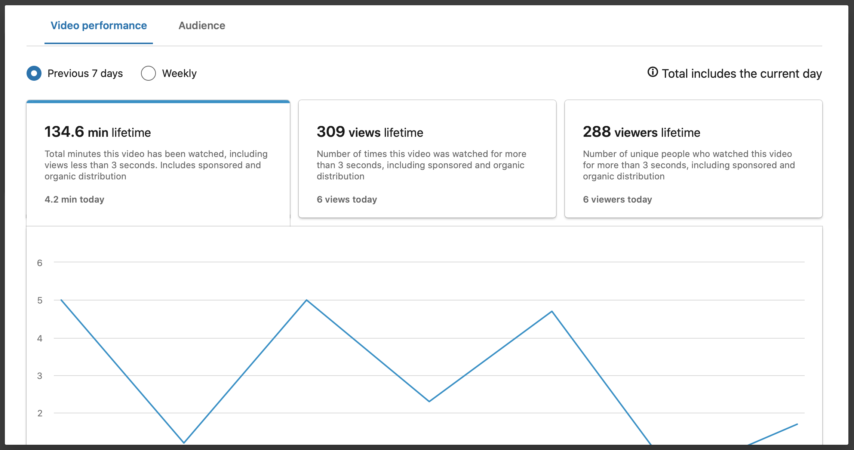
Don’t ever discount the power of LinkedIn and the ability of videos on this B2B platform. In fact, in one year LinkedIn videos garnered over 200 million impressions. They also offer a unique look at metrics with simplicity to help you nail down how your video strategy is performing on the platform.
- Plays – Amount of times your video was played.
- Views – How many times your video was watched for more than two seconds.
- View rate – Views multiplied by 100.
- eCPV – Estimated cost per view. Gives an ROI if you spend money to promote your video.
- Views at 25% – How many times have users watched a quarter of your video.
- Views at 50% – Users watched half your video.
- Views at 75% – Users watched ¾ of your video.
- Completions – Users watched 97% or more of your video.
- Completion rate – How many times users completed your video.
- Full screenplays – How many users watched your video in full-screen mode.
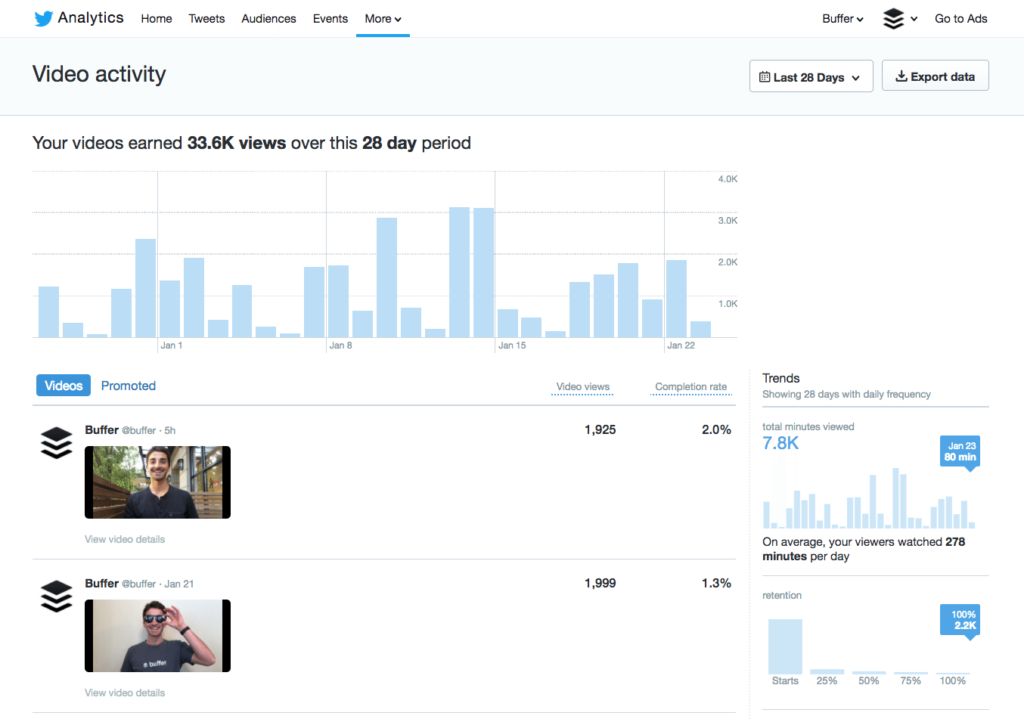
Twitter is a up-to-the-minute sharing platform with huge reach and influence in 140 characters or less. Tweets that utilize video receive 10x more engagement according to Twitter. To view your Twitter metrics, simply click on the tweet with the video you want to monitor. Click on View Tweet activity. This will allow you to view all the metrics of your tweet and video.
- Impressions – How many times users saw the tweet.
- Media views – Amount of times video was watched.
- Total engagements – Amount of time users interacted with your tweet.
- Likes – How many times have users liked your tweet.
- Details expand – People who viewed the details of your tweet.
- Replies – How many times have people replied to your tweet.
- Retweets – How many times have people retweeted your tweet.
Snapchat
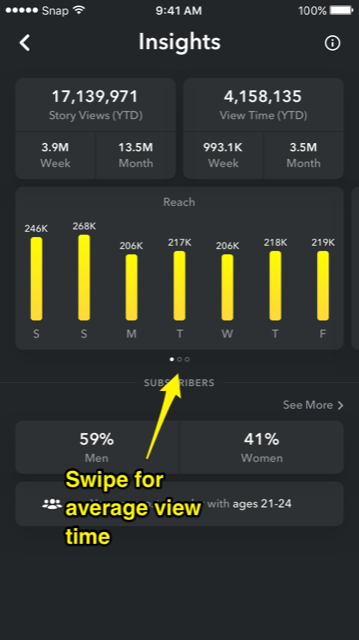
Snapchat does have some analytics, but the catch is insights are only available for verified influencers, brands or accounts with a large following. If you are able to get the verified mark on your account here are the KPIs you want to watch out for:
- Unique views – The number of different people that opened the first video on your Snapchat story for at least one second.
- View time – The minutes your viewers watched your Snapchat videos.
- Completion rate – What percentage of users finished your Snapchat story.
- Screenshots – How many users screenshotted your Snapchat story.
- Demographics – The gender, age and location breakdown of users.
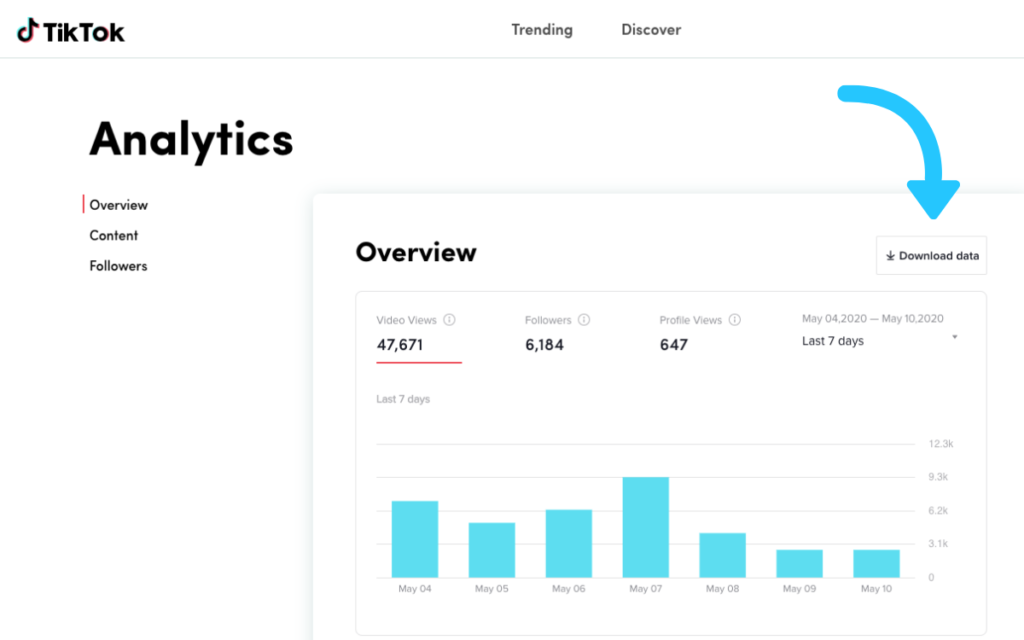
TikTok
The platform has taken Gen Z by storm and makes millennials feel like they are aging. Considered to be one of the most popular apps for the past two years you can be sure you should be taking notice of the wide audience you will have.
If you have a Pro Account, TikTok does offer a wide array of analytics to help you refine your video strategy and reach even more people.
- Video views – Time users watched your videos over the course of seven or 28 days.
- Followers – Amount of users that started to follow you over the course of seven or 28 days.
- Profile views – How many times have users viewed your profile over the course of seven or 28 days.
- Trending videos – The top nine videos with the biggest growth in views over the course of seven days.
- Followers – Current followers.
- Gender – The gender breakdown of followers.
- Top territories – Where your followers are.
- Follower activity – The time during the day as well as days of the week when your followers are most active on TikTok.
- Videos your followers watched – The videos that are popular with your followers.
- Sounds your followers listened to – The TikTok songs and soundbites that are popular with your followers.
With the wealth of information out there and amount of platforms that are used for video, it can seem overwhelming. However, your video strategy is an integral part of your marketing and determining your KPIs will help you figure out where and how to communicate with your target audience.